Prometheus + Grafana - 연결
2023. 7. 31. 10:38ㆍ개발/Monitoring
728x90
💡 준비물 : ubuntu
설치
# Grafana 설치
wget <https://dl.grafana.com/oss/release/grafana_8.5.2_amd64.deb>
sudo dpkg -i grafana_8.5.2_amd64.deb

# Prometheus 설치
wget <https://github.com/prometheus/prometheus/releases/download/v2.35.0/prometheus-2.35.0.linux-amd64.tar.gz>
tar xvfz prometheus-2.35.0.linux-amd64.tar.gz
mv prometheus-2.35.0.linux-amd64.tar.gz prometheus
모니터링 대상 설정
RabbitMQ Plugin 활성화
# rabbitmq_prometheus plugin 을 활성화시키며 exporter 포트는 15692 이다
sudo rabbitmq-plugins list
sudo rabbitmq-plugins enable rabbitmq_prometheus
설정
prometheus.yml 설정 파일
- 원하는 서비스를 모니터링 데이터 등록, 해제 가능
scrape_configs:
  # The job name is added as a label `job=<job_name>` to any timeseries scraped from this config.
  - job_name: "prometheus"

    # metrics_path defaults to '/metrics'
    # scheme defaults to 'http'.

    static_configs:
      - targets: ["localhost:9090"]
실행
# Promeheus 실행 명령어
./prometheus/prometheus

# Grafana 실행 명령어
service grafana-server start

# 방화벽 오픈
firewall-cmd --permanent --zone=public --add-port=3000/tcp
firewall-cmd --permanent --zone=public --add-port=9090/tcp
firewall-cmd --reload
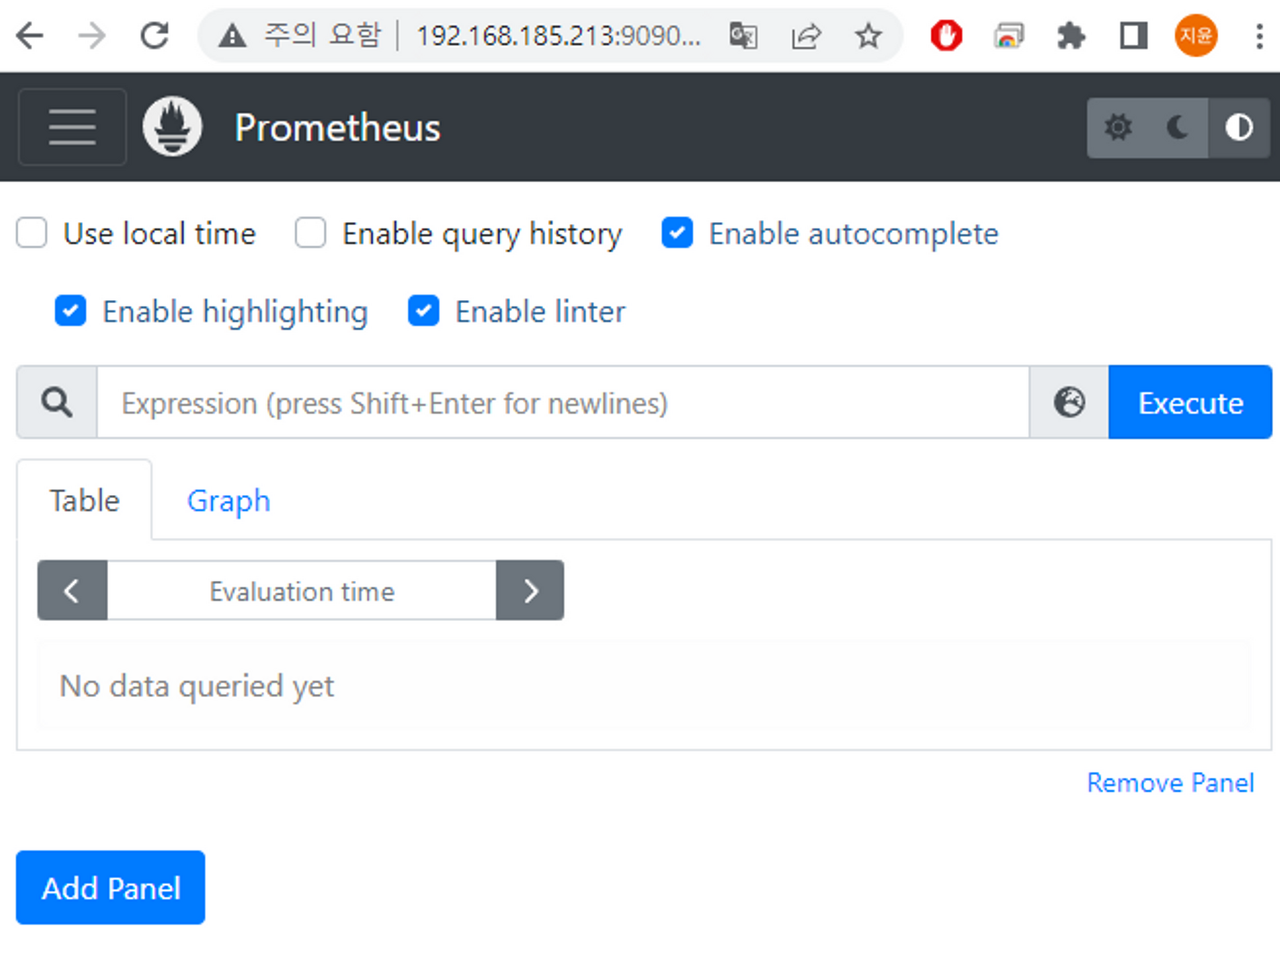
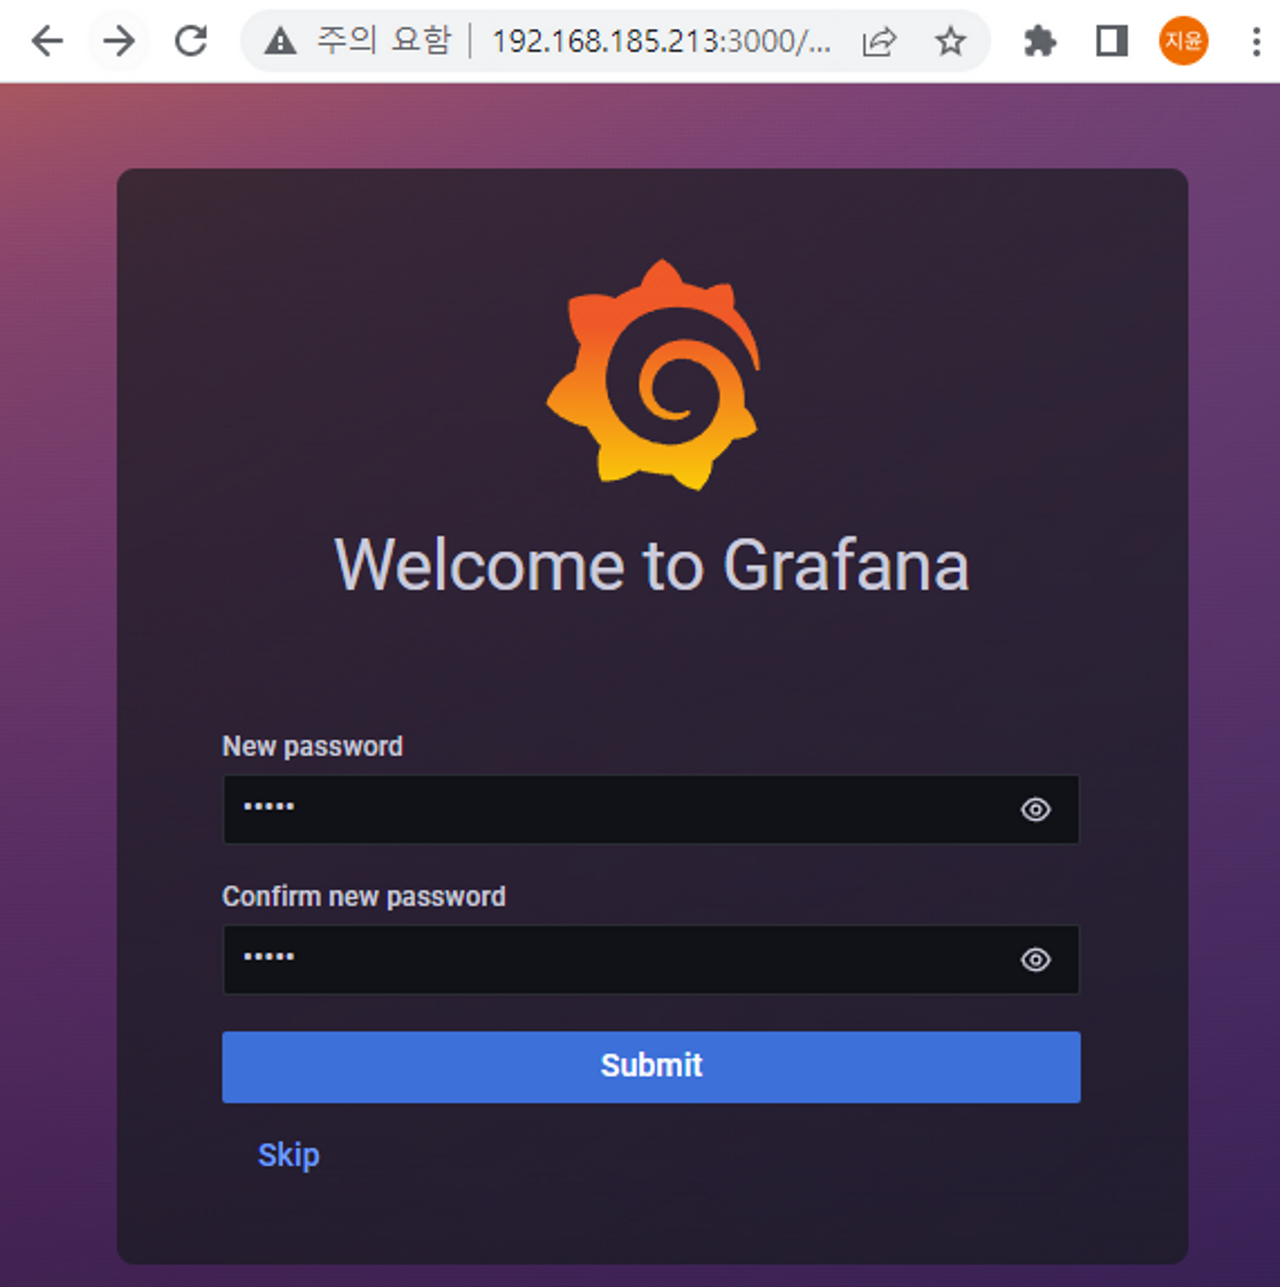
실행 화면
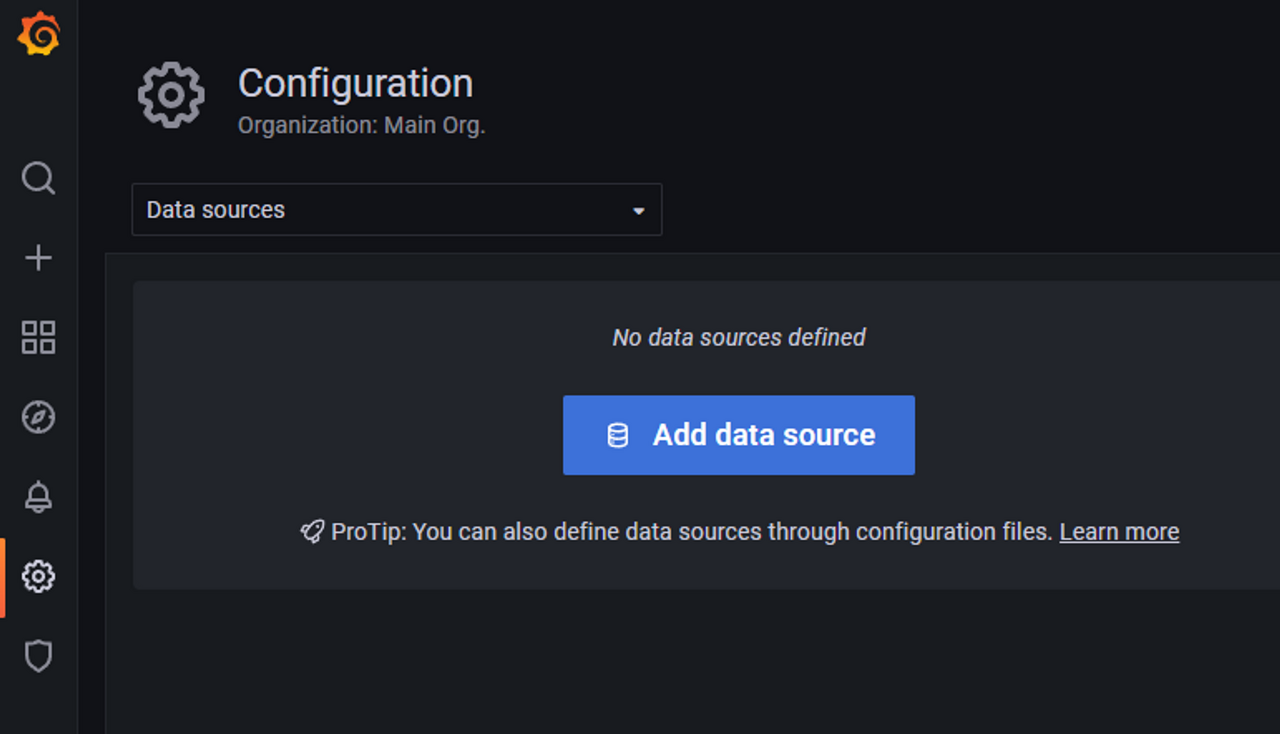
Grafana + Prometheus 연결

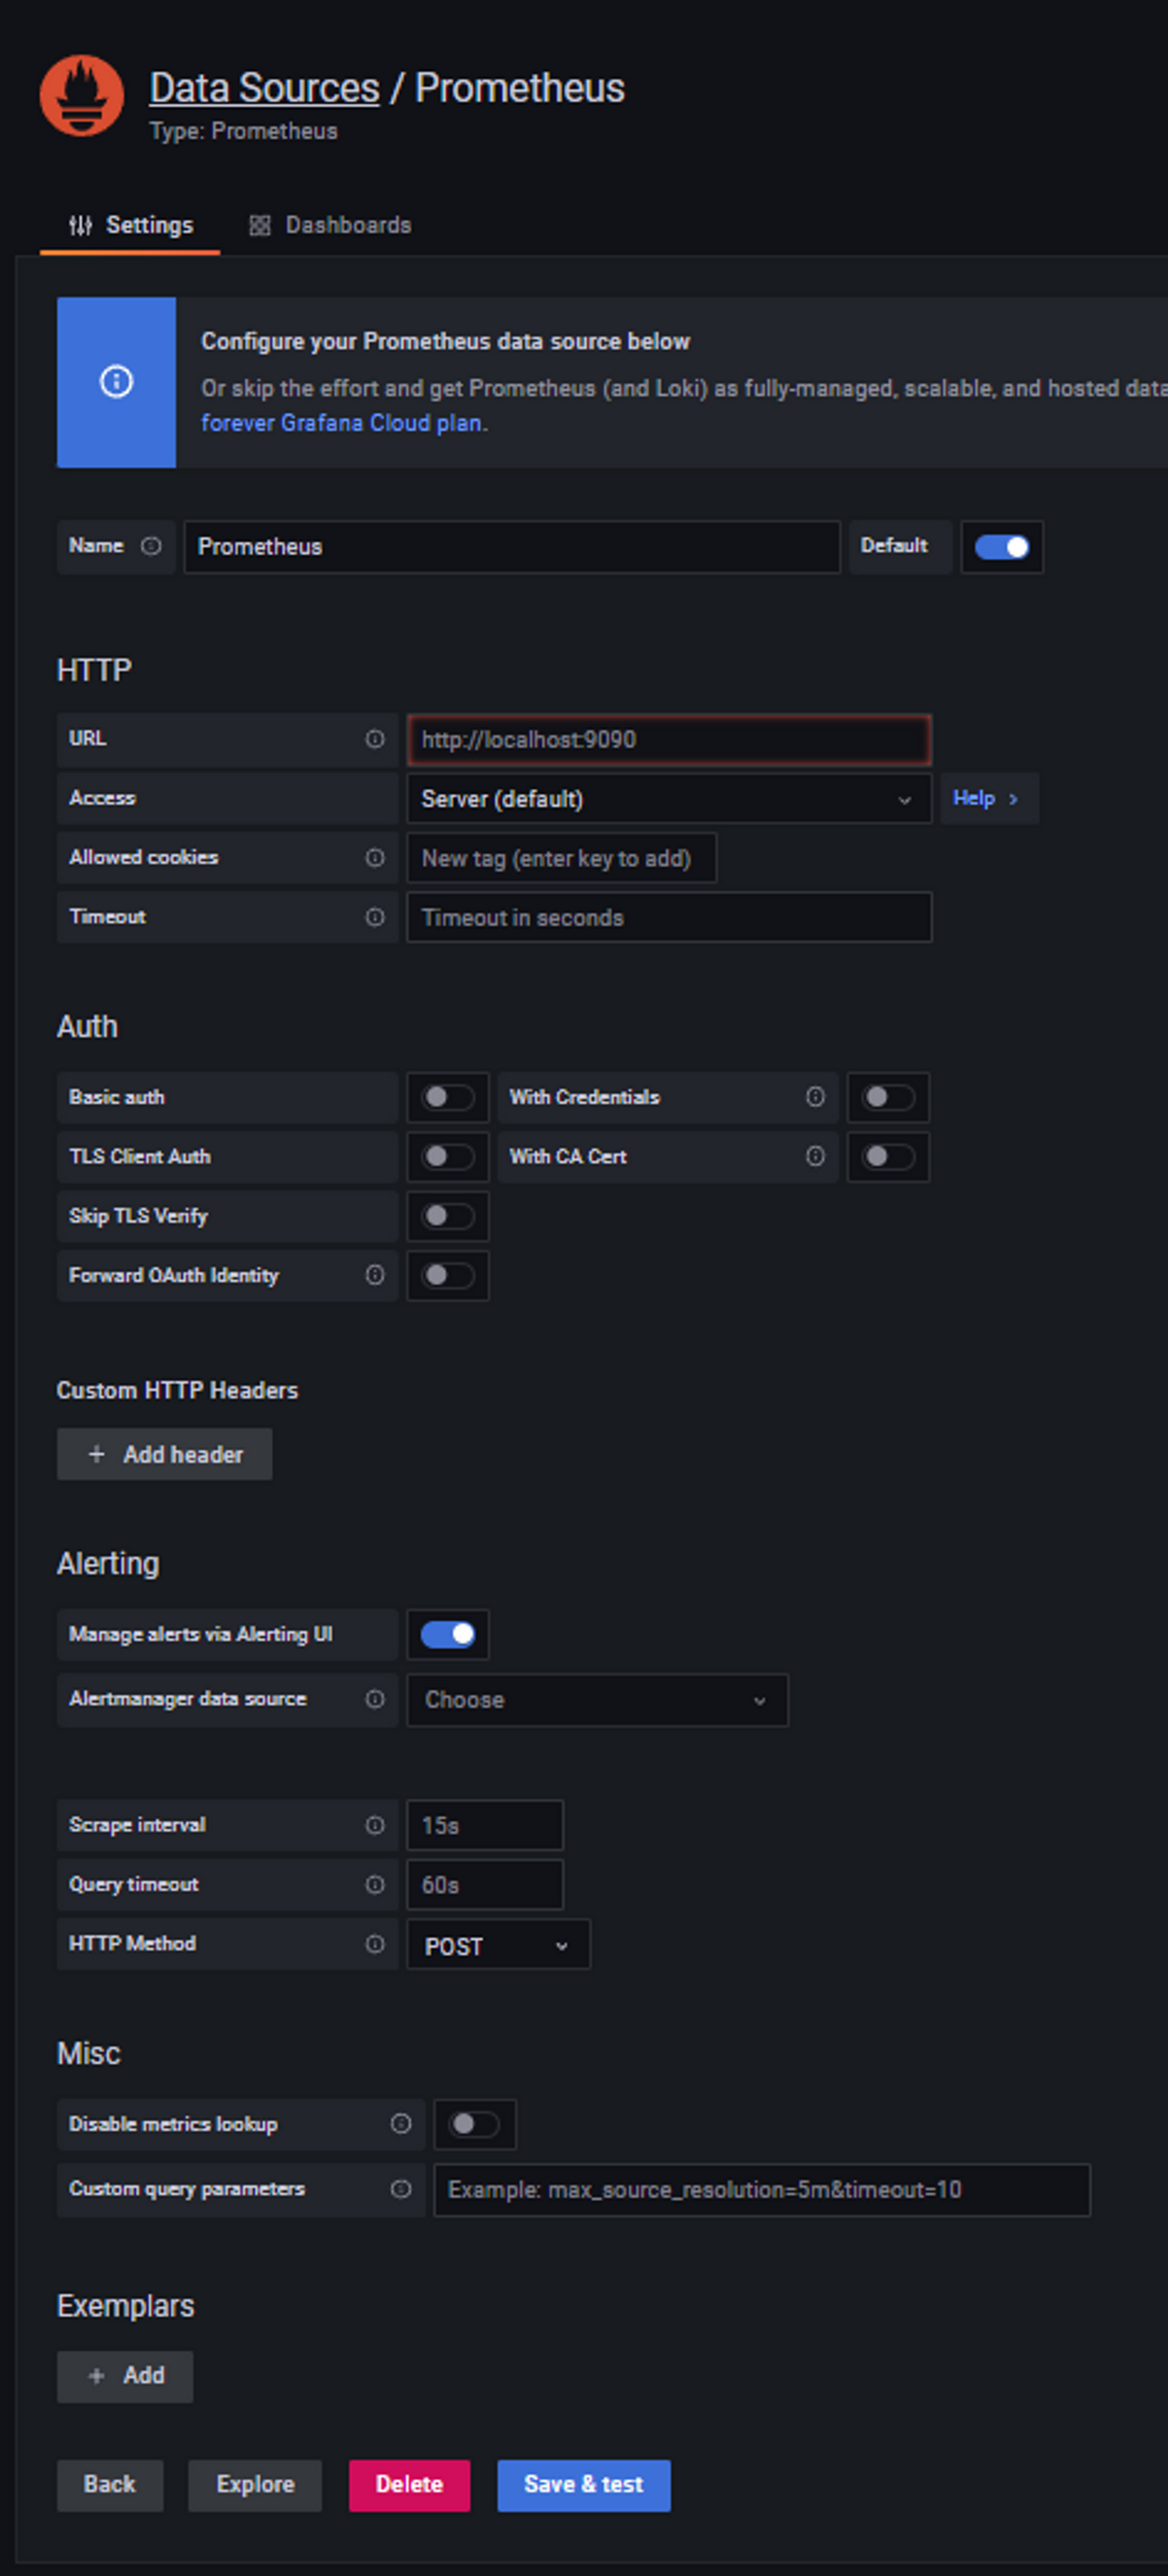
URL 값에 Prometheus URL 작성 후 Save & Test 클릭
728x90
'개발 > Monitoring' 카테고리의 다른 글
| Prometheus + Grafana - RabbitMQ 구축 (0) | 2023.07.31 |
|---|---|
| Prometheus + Grafana - Redis 구축 (0) | 2023.07.31 |
| Prometheus, Grafana - 이론 (0) | 2023.07.31 |